Old Q0957+561 data & software:
![]()
![]()
![]()

► Simple FORTRAN programs to apply the d2 test (accurate and robust time delay measurements)
► Photos
Advertising:
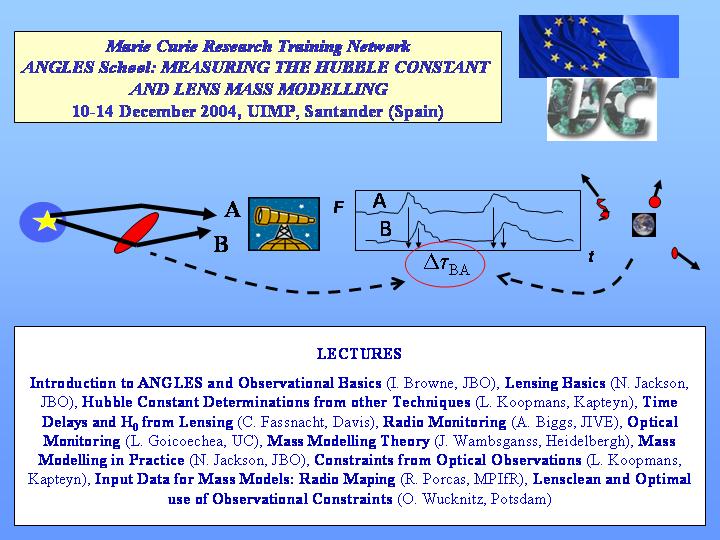
We can measure the time delay between
the intrinsic
features that appear in the two images A and B of QSO 0957+561 (with
relation
to A, B is delayed in TBA). As
it
was discussed by Lehar et al. (1992, ApJ 384, 453), the irregular
delay-peak
of the AB cross-correlation function should be closely traced
by the
symmetrical central peak (around the lag t =
0) of the AA (or BB) autocorrelation
function.
Moreover, other features of the cross-correlation function around lags t1, t2,...
will be closely reproduced in the autocorrelation function around lags t1-TBA, t2-TtBA,..., respectively. Therefore, if the shifted discrete autocorrelation (DAC) is
matched to the discrete cross-correlation (DCC), in
principle, one derives a
robust value of the time delay. This self-consistent methodology is
called the delta-square test, and it was
successfully applied to three golden datasets for QSO 0957+561A,B:
1995/1996 seasons in the g and r bands by Kundic et
al. (1997, ApJ 482,75) (NSU Proc.) and
1997/1998 seasons in the R band by the Instituto de Astrofisica de
Canarias (IAC) group (article including the analysis
of the IAC dataset). From the golden
light curves and the delta-square test, we inferred typical delays of
422-425 days, which led to a cosmological
expansion of about 66 km / s / Mpc.
However, we note that the delay between the dominant events in the Kundic et al.'s g-band records is of 417 ± 3 days (95% confidence level; see Table 1 in Kundic et al.), so we obtained an anomalous delay from the g-band Apache Point Observatory (APO) dataset and the delta-square technique. A detailed study of the of the g-band APO photometry enabled us to discover two different true time delays of 417.0 ± 0.6 days and 432.0 ± 1.9 days (68% confidence levels), which are associated with two different pairs of twin events. If there are multiple delays (IAC: 425 days, APO: 417 and 432 days), the time delay distribution can be used to discuss the structure of the rapid variability source (Yonehara et al. 1999, ApJ 519, L31). By assuming that the intrinsic events were originated inside a standard hybrid source (nuclear accretion disk and circumnuclear stellar region), the more plausible interpretation is that two of the three flares (causing the observed events) must be generated at distances (from the central black hole) larger than 90 pc, i.e., within the innermost stellar region. A starburst scenario is roughly consistent with the APO observations (see the articles on the discovery and a deeper analysis). As a general conclusion, we found evidences for a rapid variability source with a size larger than 200 pc. The standard hybrid scenario is one possibility, but other scenarios are also viable, e.g., binary black hole and disk-jet system.
MICROLENSING AND EXTINCTION
The IAC group have monitoring QSO
0957+561A,B over the past 8 years (from 1996 February) with the 82 cm
IAC-80 telescope at Teide Observatory and have obtained a large R band
dataset. From the first 2.5 years of data, we made two new combined light curves [A (time
delay-advanced) = green
circles, B (magnitude-shifted) = red
squares] and the corresponding difference light curves. To date, about 330
days of overlap between the time delay-advanced photometric data of
image A and the magnitude-shifted observations of image B were analyzed
in great detail. In the difference light
curves, we observed noisy behaviours around the zero line and no
short-timescale events (with a duration of months),
where the term event refers to a prominent feature that may be due to
microlensing or another source of variability. From simulations, we
concluded that the variability in both
difference signals can be due, in a natural way, to the observational
noise. We also
discussed the sensitivity
of the telescope to several classes of microlensing variability. You
are
free to get the photometric data used in the analysis.
The Gravitational Lenses International Time Project (GLITP)
collaboration observed the first gravitational lens system (QSO
0957+561) from 2000 February 3 to 2000 March 31. The daily VR
observations were made with the 2.56-m Nordic Optical Telescope at
Roque de los Muchachos Observatory, La Palma (Spain). We have derived
detailed and robust VR light curves of the two components
Q0957+561A and Q0957+561B (PSF
photometry, V, R). In spite of the excellent
sampling rate, we have not found evidence in favor of true daily
variability. With respect to variability on time-scales of several
weeks, we measure VR gradients of about -0.8 mmag/day in QSO
0957+561A and + 0.3 mmag/day in
QSO 0957+561B. The gradients are very probably originated in the far
source, thus adopting this reasonable hypothesis (intrinsic
variability), we compare them to the expected gradients during the
evolution of a compact supernova remnant at the redshift of the source
quasar. The starburst scenario is roughly consistent with some former
events (see here above), but the new gradients do not seem to be caused
by supernova remnant activity. The complete paper
is available at the astro-ph archive. On the other
hand, we inferred the optical fluxes of the two components of the
lensed quasar in April 2001. The images were also taken with the Nordic
Optical Telescope in the V and R filters (service
time). The whole data set (GLITP + service
time) has let us to
obtain the VR magnification ratios for all the interval of
possible time delays (roughly 415-430 days). Finally, we have tested two possible scenarios for the
origin
of these optical ratios: differential extinction due to dust in the
intervening systems and gravitational microlensing by compact objects
in the lens galaxy. As soon as possible, the
link to the new study on microlensing/extinction and the whole set of
images will be put in this Web site.
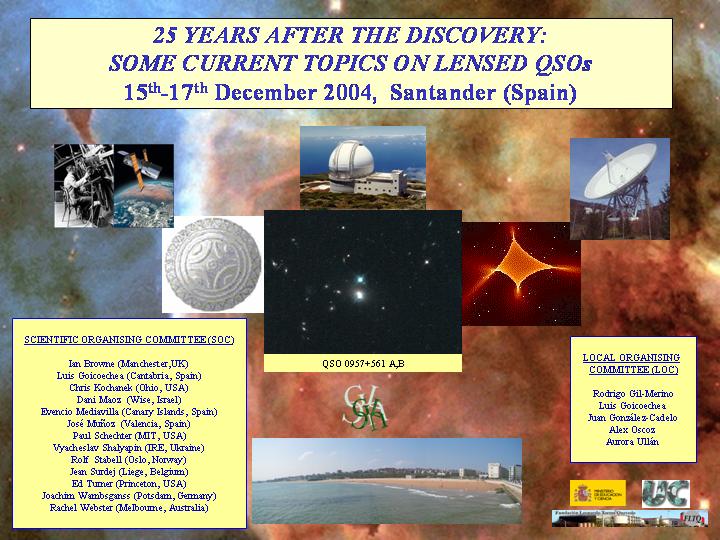
![]() QSO 0957+561
QSO 0957+561
![]()
OPTICAL MONITORING: VR fluxes of this double quasar were inferred from observations at Calar Alto Observatory (1.5 m telescope), Spain, in 2003. The Calar Alto light curves are being complemented with additional fluxes derived from frames taken at Fred Lawrence Whipple Observatory (USA) and Wise Observatory (Israel) . During the first part of this programme, we closely collaborated with the ITA group at Oslo (Norway). Since 2005 January, we are conducting a monitoring programme with the 2.0 m Liverpool Robotic Telescope (LRT) . A detailed reduction of frames from two different techniques (deconvolution and PSF fitting) indicated the existence of a prominent fluctuation in the g-band light curve of Q0957+561A. The variability seems chromatic, with a smaller fluctuation in the r band (LEFT PANEL: blue/red points = deconvolution, white points/lines = PSF fitting). The prominent g-band gradient in the brightness of Q0957+561A occured in 2005 October-November (see the box within the LEFT PANEL), so a similar gradient will be very probably seen in the g-band light curve of Q0957+561B in 2006 December-2007 January (see this paper for more details). We are working on these exciting LRT frames (from late 2006 to early 2007). A true subframe containing the system, the corresponding PSF fitting model and the residues are also shown in the RIGHT PANEL.
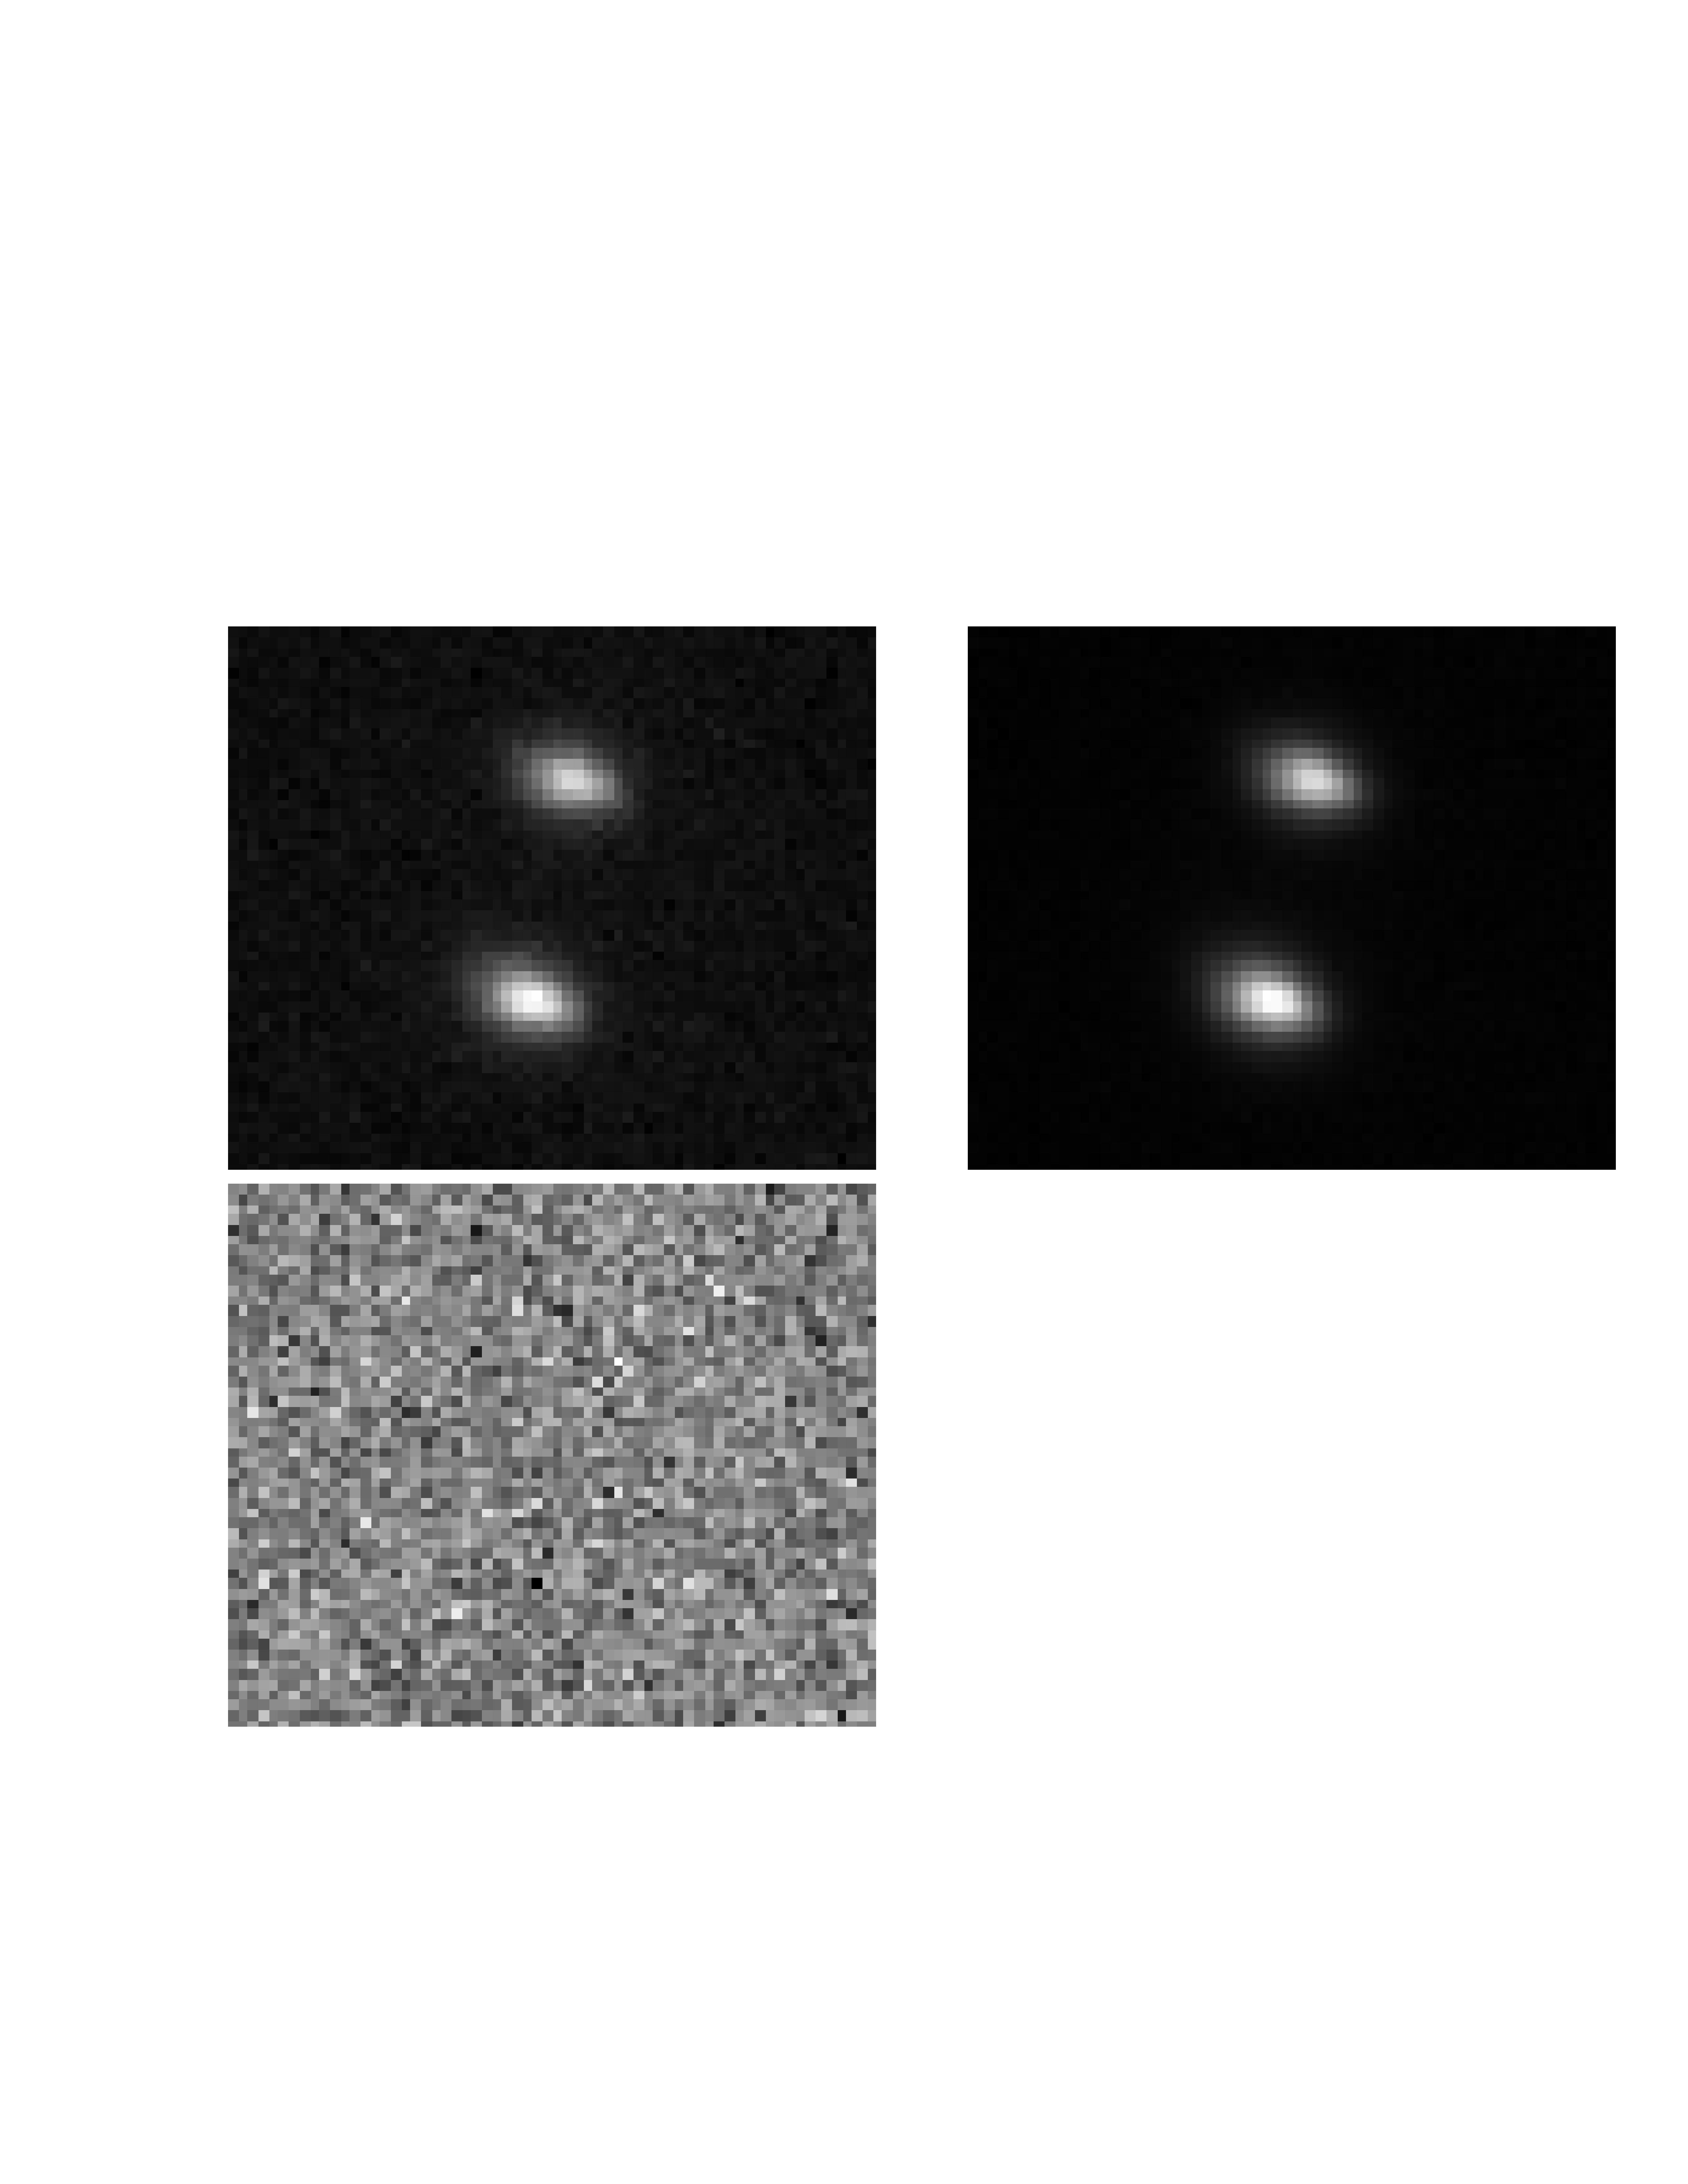 (click on the figure to enlarge)
IR IMAGES: From HST observations of Q0957+561A and Q0957+561B separated in time by the known time delay in this system, Goicoechea et al. (2005) analysed IR/optical/UV spectra of the two components A and B. The flux ratio of components (B/A) led to important information on the dark halo of the main lens galaxy (a giant elliptical at z = 0.36). The measurements for the continuum are in good agreement with extinction in the elliptical galaxy and a small fraction of mass in collapsed objects (no need for gravitational microlensing). However, as due to the possible contamination of the IR spectrum of B, the measured IR flux ratio was not considered in the analysis. So, in order to get a more complete perspective, we are obtaining new IR images (in the J and H bands) with SupIRCam at LRT.