Old Q0957+561 data & software:
► Simple FORTRAN programs to apply the d2 test (accurate and robust time delay measurements)
► Photos
Advertising:
|
HST-STIS SPECTRA OF QSO 0957+561 |
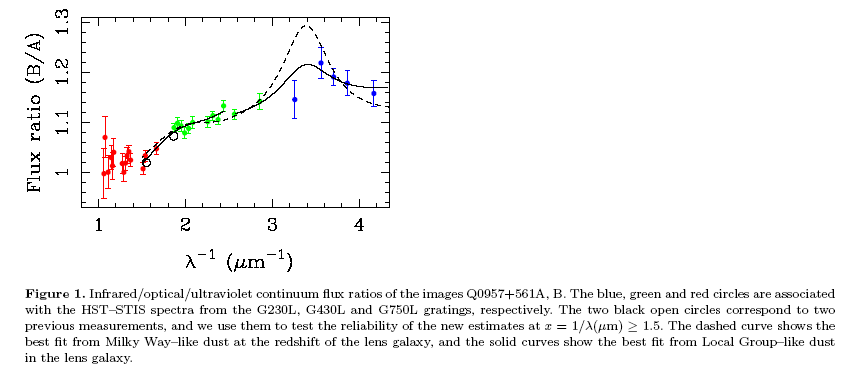
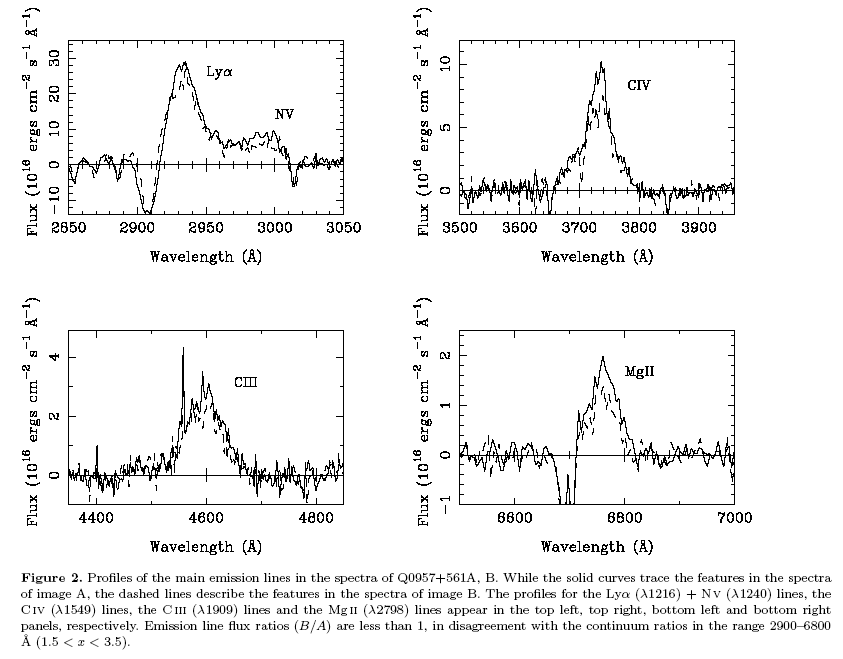
Spectra of Q0957+561A and Q0957+561B were obtained in 1999 April 15 and 2000 June 2-3, respectively, with the Space Telescope Imaging Spectrograph (STIS) on board the HST. The spectra of each image cover a wide range of wavelengths, from the near-infrared (NIR) to the ultraviolet (UV), since the G230L, G430L and G750L gratings were used in the experiment. The central wavelengths of these gratings are 0.24
mm (G230L), 0.43 mm (G430L) and 0.77 mm (G750L). A 52 ´ 0.2 arcsec2 slit was also used in each observation. The final data (flux vs. wavelength) are calibrated with the last version of the CALSTIS pipeline software (v2.15c, 29 January 2004), so the corrections for time-dependent sensitivity of the MAMA detectors (which is relevant for the G230L observations) as well as for charge-transfer efficiency of the CCD detector (relevant for the G430L and G750L observations) are incorporated. The relevant data files are:
Q0957+561A/G230L Q0957+561B/G230L
Q0957+561A/G430L Q0957+561B/G430L
Q0957+561A/G750L Q0957+561B/G750L .
CONTINUUM FLUX RATIOS (averaging over independent intervals of 100 Å; results from this FORTRAN file)
Central wavelength Flux ratio (B/A) Error in B/A
(Å)
2400.000
1.158076
2.6371948E-02
2590.000
1.178547
2.5041372E-02
2700.000
1.190996
1.6915184E-02
2810.000
1.219100
3.0338937E-02
3070.000
1.145900
3.7491947E-02
3500.000
1.142315
1.5858240E-02
3900.000
1.116825
1.0021350E-02
4100.000
1.133345
1.0237115E-02
4210.000
1.105921
1.0108775E-02
4320.000
1.113857
9.0285232E-03
4430.000
1.101657
1.1300926E-02
4800.000
1.100102
1.1657312E-02
4910.000
1.088247
9.1866311E-03
5020.000
1.079346
1.0172051E-02
5130.000
1.093521
1.0703269E-02
5240.000
1.098544
1.2220921E-02
5350.000
1.089939
8.7200934E-03
6000.000
1.047736
1.2290484E-02
6500.000
1.034119
1.1102841E-02
6610.000
1.007791
1.2159928E-02
7300.000
1.025052
1.3210475E-02
7410.000
1.041935
1.3225742E-02
7520.000
1.034279
1.5076437E-02
7630.000
1.018898
1.4216989E-02
7740.000
1.000759
1.9093486E-02
7850.000
1.018336
2.0242479E-02
8500.000
1.040726
2.7930584E-02
8610.000
1.013656
2.7357228E-02
8720.000
1.030178
2.3813087E-02
9000.000
1.000969
3.3085965E-02
9300.000
1.070461
4.1031498E-02
9410.000
0.9979929
4.9538895E-02

EMISSION LINE FLUX RATIOS
Emission line Flux ratio (B/A)
MgII (l2798) 0.64 ± 0.04
CIII (l1909) 0.78 ± 0.03
CIV (l1549) 0.77 ± 0.02
NV (l1240) 0.67 ± 0.07
Lya (l1216) 0.87 ± 0.03

The paper on the analysis and interpretation of the spectra is available HERE.


