Old Q0957+561 data & software:
► Simple FORTRAN programs to apply the d2 test (accurate and robust time delay measurements)
► Photos
Advertising:
Old Q0957+561 data & software:
► Simple FORTRAN programs to apply the d2 test (accurate and robust time delay measurements)
► Photos
Advertising:
|
QSO 0957+561AB |
● g-SDSS: QSO 0957+561A & QSO 0957+561B
QSO 0957+561A (including fluxes from some frames with 80 < SNR < 100)
● r-SDSS: QSO 0957+561A & QSO 0957+561B

New two-colour light curves of Q0957+561: time delays and origin of intrinsic variations (A&A)
Structure function of the UV variability of Q0957+561 (A&A)
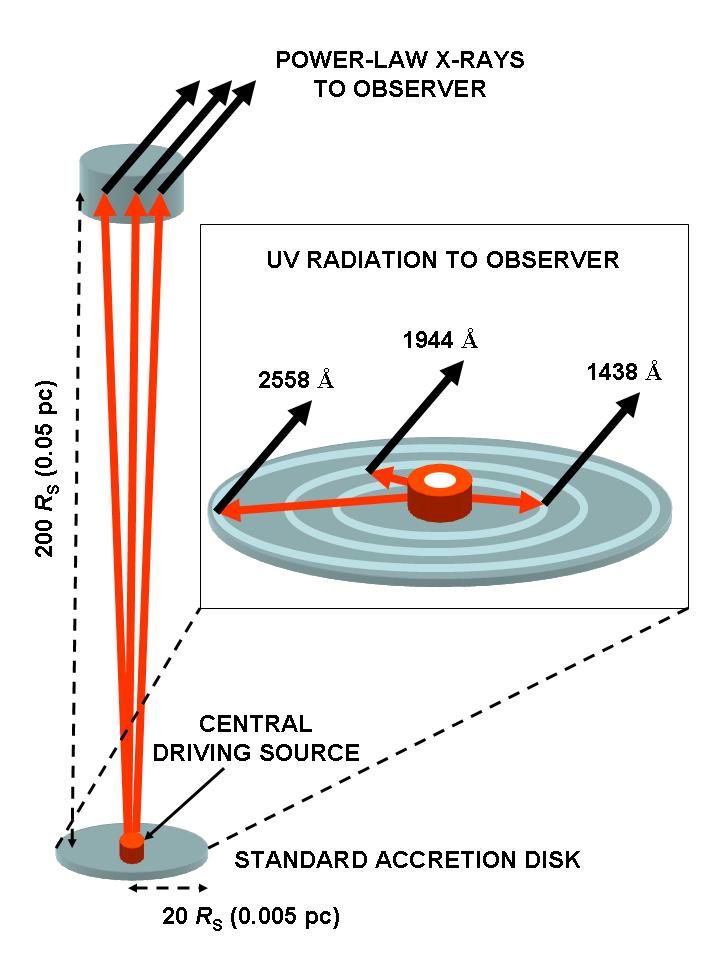
● Press Release: Mystery Of Twin Quasar Brightness Revealed
● The Astronomer's Telegram: An opportunity for a multi-wavelength follow-up of a prominent event in the brightness of Q0957+561B in the first semester of 2010
● Time evolution of Q0957+561B in the ugriz filters in 2010 (Swift/UVOT + LRT)
Accretion onto the Supermassive Black Hole in the High-redshift Radio-loud AGN 0957+561 (ApJ)

Continuum reverberation mapping in a z = 1.41 radio-loud QSO (J. Phys. Conf. Ser.)
● Relevant datasets for Q0957+561B in 2010
[Time (MJD-50000), Flux (10-12 erg s-1 cm-2 in X-rays and mJy in UV/optical bands), Error in flux]:
- X-ray (absorbed power-law & unabsorved power-law)
- UV (U band)
● Q0957+561A and Q0957+561B from NUV to NIR (2010)
[Time (MJD-50000), SA (mJy),
s(SA), SB (mJy), s(SB)]:- UV (U band)
A 5.5-year robotic optical monitoring of Q0957+561: substructure in a non-local cD galaxy (A&A)
● Global dataset:
- ReadMe
- Table 1: Fluxes in the g band (4686 Å)
- Table 2: Fluxes in the r band (6165 Å)
- On the time delays from the Liverpool main fluctuations:
resampled g-band light curves (45 data points): Q0957+561A and Q0957+561B
A(+ 417 days) & B [left panel], as well as AB cross-correlation (filled circles) & average autocorrelation (+ 417 days; open circles) for α = 6 days [middle panel] and a = 9 days [right panel]:
resampled r-band light curves (45 data points): Q0957+561A and Q0957+561B
A(+ 417 days) & B [left panel], as well as AB cross-correlation (filled circles) & average autocorrelation (+ 417 days; open circles) for α = 6 days [middle panel] and a = 9 days [right panel]:
Spectra of faint sources in crowded fields with FRODOSpec on the Liverpool Robotic Telescope (Astron. Nachr.)
 Polarimetric
monitoring with RINGO since 2011

 LT
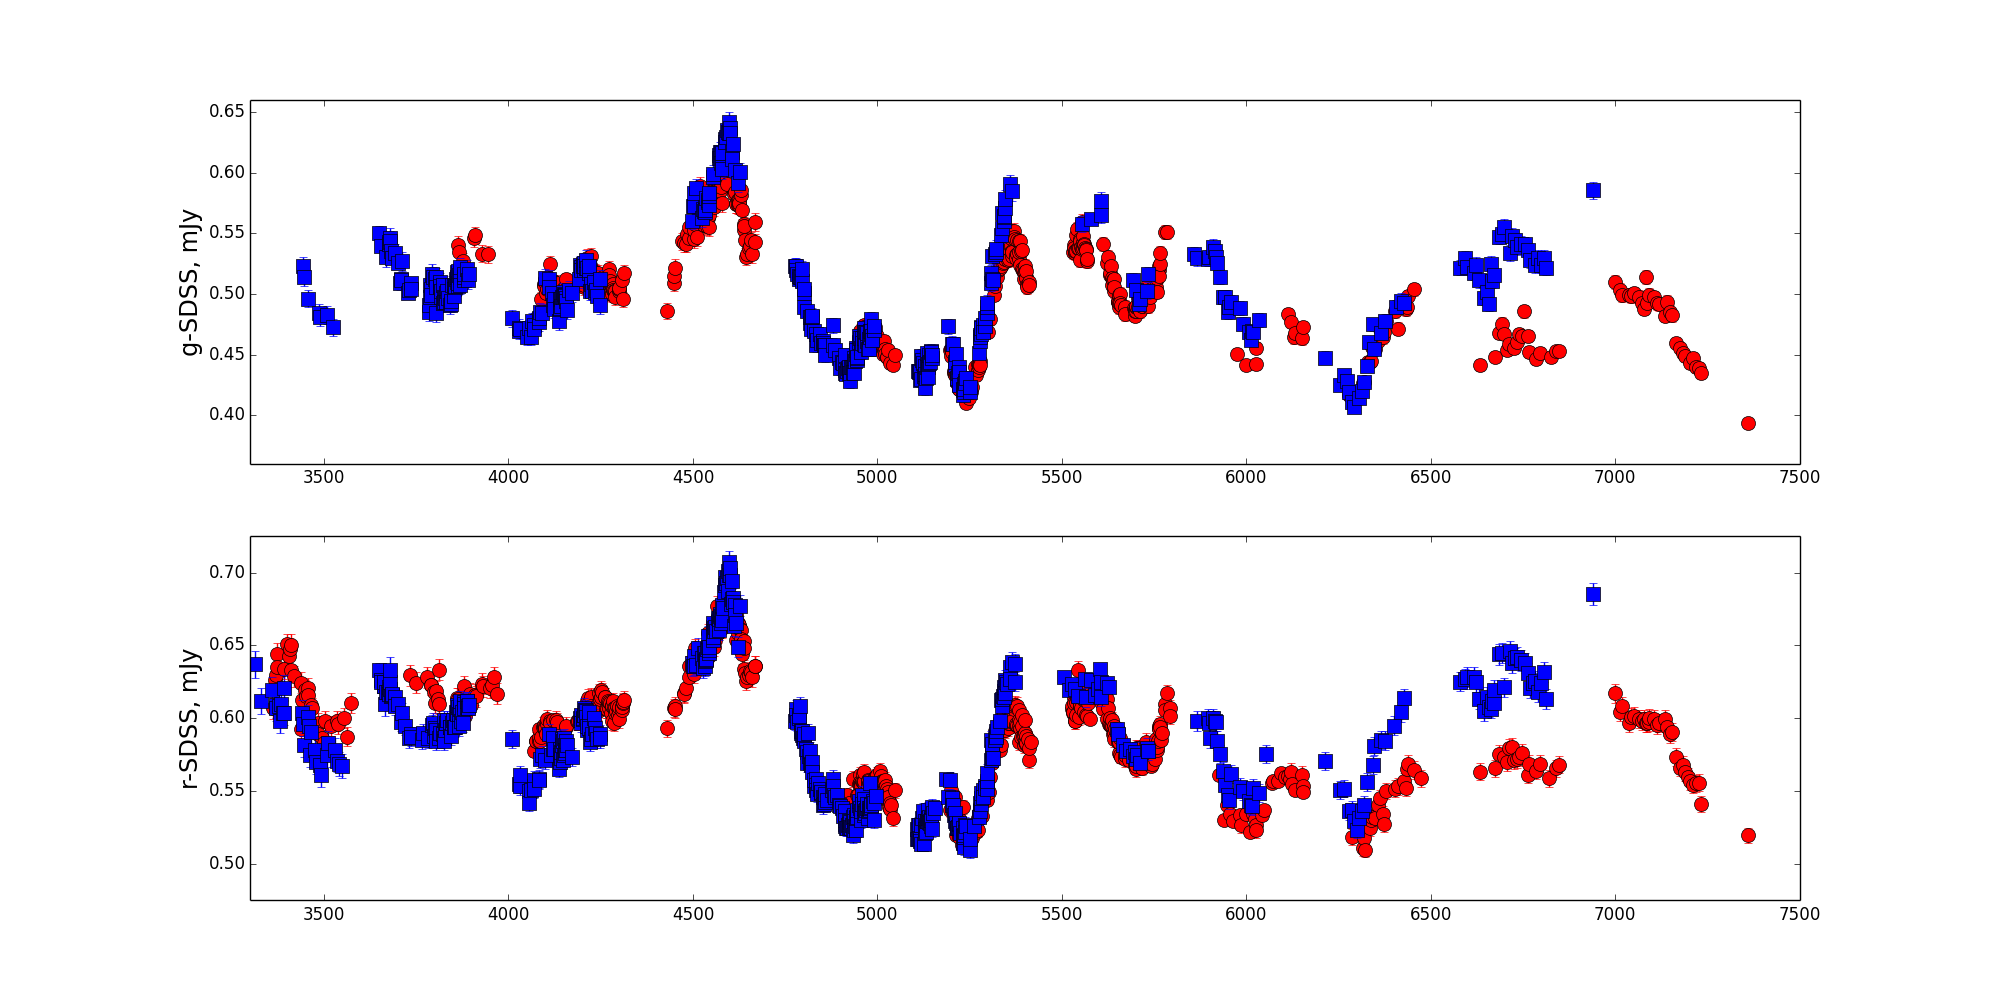
+ IAC80 light curves in 1996–2016 (21 years)
A = red circles B = blue squares

LT light curves in 2005–2014 (10 years): suitable scale factors and time shifts are used to show the agreement/disagreement between A and B

 New database for
a sample of optically bright lensed quasars in the northern hemisphere
(A&A)
● Datasets:
– Table 6: IAC80-LT light curves in the r band [1067 epochs in 1996-2016]
--------------------------------------------------------------------------------
Columns
--------------------------------------------------------------------------------
Col. 1: MJD-50000 (Modified Julian Date - 50000)
Col. 2: mA (Magnitude of QSO B0957+561A)
Col. 3: emA (Error in magnitude of QSO B0957+561A)
Col. 4: mB (Magnitude of QSO B0957+561B)
Col. 5: emB (Error in magnitude of QSO B0957+561B)
--------------------------------------------------------------------------------
– Table 8: LT/FRODOSpec (red grating) spectra [16 epochs in 2010-2014]
Subtables: 8a, 8b, 8c, 8d, 8e, 8f, 8g, 8h, 8i, 8j, 8k, 8l, 8m, 8n, 8o, 8p
Observing dates (yyyymmdd): a = 20101105, b = 20101109, c = 20101223,
d = 20110109, e = 20110109, f = 20110224, g = 20110301, h = 20110410, i = 20110530, j = 20111024, k = 20111101, l = 20111205, m = 20111218, n = 20111221, o = 20130220, p = 20140104
--------------------------------------------------------------------------------
Columns
--------------------------------------------------------------------------------
Col. 1: lambda (Observed
wavelength in Angstroms)
Col. 2: FA (Flux of QSO B0957+561A in 10-17 ergs cm-2 s-1
Å-1)
Col. 3: FB (Flux of QSO B0957+561B in 10-17 ergs cm-2 s-1
Å-1)
Col. 4: FGAL (Flux of the main lensing galaxy in 10-17 ergs cm-2
s-1 Å-1)
--------------------------------------------------------------------------------
– Table 9: LT/SPRAT spectra [5 epochs in 2015-2017]
Observing dates (yyyymmdd): a = 20150315, b = 20151119, c = 20151121,
d = 20170117, e = 20170118
--------------------------------------------------------------------------------
Columns
--------------------------------------------------------------------------------
Col. 1: lambda (Observed
wavelength in Angstroms)
Col. 2: FA (Flux of QSO B0957+561A in 10-17 ergs cm-2 s-1
Å-1)
Col. 3: FB (Flux of QSO B0957+561B in 10-17 ergs cm-2 s-1
Å-1)
--------------------------------------------------------------------------------
– Tables 10-11: NOT/ALFOSC spectra [3 epochs in 2010-2013]
Subtables 10 (grism 7): 10a, 10b, 10c
Subtables 11 (grism 14): 11a, 11b, 11c
--------------------------------------------------------------------------------
Columns
--------------------------------------------------------------------------------
Col. 1: lambda (Observed
wavelength in Angstroms)
Col. 2: FA (Flux of QSO B0957+561A in 10-17 ergs cm-2 s-1
Å-1)
Col. 3: FB (Flux of QSO B0957+561B in 10-17 ergs cm-2 s-1
Å-1)
--------------------------------------------------------------------------------


