Old Q0957+561 data & software:
► Simple FORTRAN programs to apply the d2 test (accurate and robust time delay measurements)
► Photos
Advertising:
|
SDSS J1001+5027AB |
 Spectrophotometric monitoring since 2013
FRODOSpec: lensed images within the FOV (January 6, 2014) and preliminary spectra at two different epochs (November 7, 2013 & March 26, 2014)
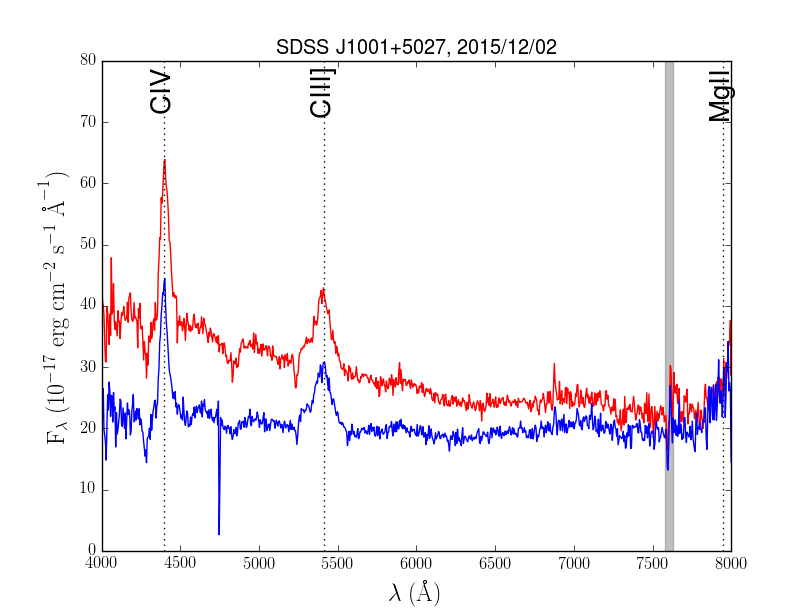
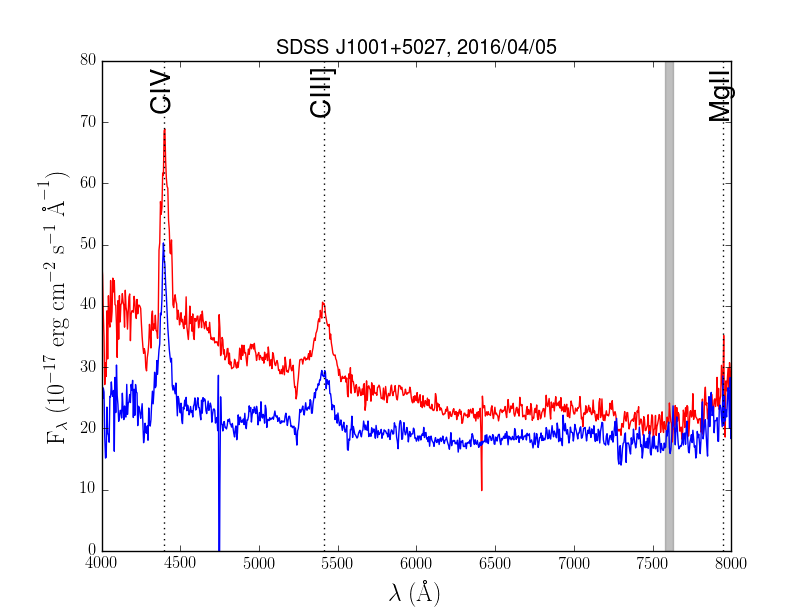
SPRAT: preliminary spectra in 2015–2016


 New database for a sample
of optically bright lensed quasars in the northern hemisphere
(A&A)
● Datasets:
– Table 13: LT/FRODOSpec (red grating) spectra [3 epochs in 2013-2014]
Observing dates (yyyymmdd): a = 20131107, b = 20140208, c = 20140326
--------------------------------------------------------------------------------
Columns
--------------------------------------------------------------------------------
Col. 1: lambda (Observed
wavelength in Angstroms)
Col. 2: FA (Flux of SDSS J1001+5027A in 10-17 ergs cm-2 s-1
Å-1)
Col. 3: FB (Flux of SDSS J1001+5027B in 10-17 ergs cm-2 s-1
Å-1)
--------------------------------------------------------------------------------
– Table 14: LT/SPRAT spectra [4 epochs in 2015-2016]
Observing dates (yyyymmdd): a = 20150226, b = 20151202, c = 20160405,
d = 20161206
--------------------------------------------------------------------------------
Columns
--------------------------------------------------------------------------------
Col. 1: lambda (Observed
wavelength in Angstroms)
Col. 2: FA (Flux of SDSS J1001+5027A in 10-17 ergs cm-2 s-1
Å-1)
Col. 3: FB (Flux of SDSS J1001+5027B in 10-17 ergs cm-2 s-1
Å-1)
--------------------------------------------------------------------------------


